Aruba E-invoicing App
Project overview
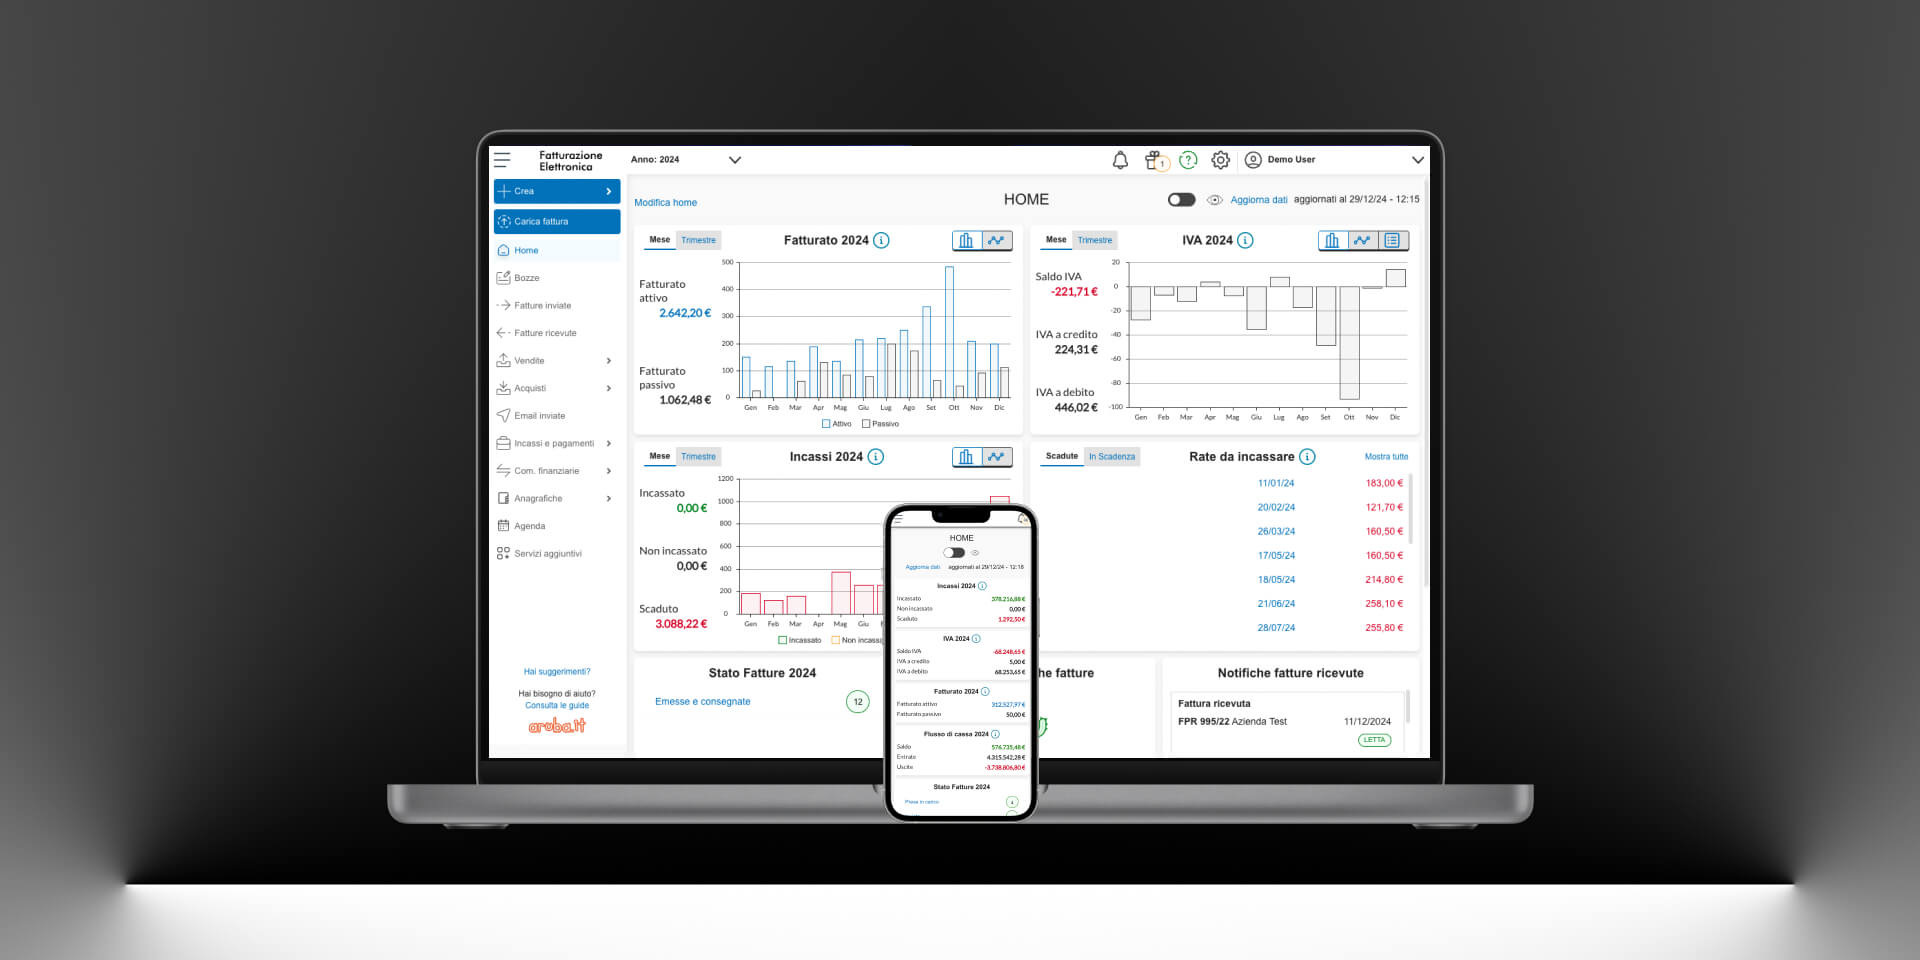
Aruba E-invoicing app is a single page app.
Team
I designed it from the ground up.
Up to 3 designers on call.
My role
UX designer - UI designer - Lead designer

When
From 2016 to present.
Problems
Aruba’s E-invoicing software (used for invoicing public administrations) had high support costs due to poor design.
The company plans to redesign it to reduce these costs.
Curiosity
The project manager handed me a project document and told me to start designing it. With ~150k active users, I requested a 6 weeks to conduct user research to create a better experience, suited to their needs. Aruba was known for its low prices but not for the usability of its solutions.

First research iteration
Research insights
People do not understand the terminology specific to electronic invoicing.
The information architecture is unclear, and users cannot find invoice drafts.
Second research iteration
The idea
Testing
Testing insights
The assisted input and out-of-focus validation patterns are appreciated by users, as they help prevent errors or resolve them immediately.
The new information architecture is clear and easy to understand.
Users appreciate the table filters, designed similarly to Excel, as they are used to it.
Results

Goal
Six months after the release of the new version of the software, support costs decreased by 80%.
Curiosity
The Italian government decided to extend the use of electronic invoicing to all companies, and our software was easily adapted to include this functionality.
Product growth
Research
We run surveys to understand user satisfaction, their needs, pain points, and to test new business ideas.
We analyze feedback daily, clustering and measuring it against each other; this helps guide the roadmap.
Testing
When we introduce new design patterns or complex features, they are first tested with users.
Results after 7 years

+ 1M users
We have over one million paying users.
We have grown by 614%.

Design win
A Nielsen study states that the primary reason for purchasing the product is its simplicity, with price being the second reason.

Rating
The company’s most complex product has the highest CSAT (4,6) and MOOD rating (3,2).

Modules
We have created 4 additional modules, making the product an almost complete management system.